-
How to use Resultal
How to use the platform (and how to get the most out of it)
On this page, you will find an overview of the main menu functions, and short step-by-step tutorials on how to create and manage your experiments and tasks.
Are you an affiliate user?
Please click here to register with your affiliate email account
(You need to use the email account from your affiliated organization to get access)Using SONA Systems with Resultal
Click here for the tutorial - How to connect your Resultal experiment with SONA
Does your university or educational institution use the participant management software SONA Systems ?
With Resultal it is now possible to automatically grant SONA credits after completion of your survey or experiment.
Menu (main functions you find in the left menu after login)
Here you find a chart-overview to monitor results from your running experiments and tasks.
This dashboard overview only displays quantitative/numerical data, no open (written) answers.
This section shows a partaking timeline and an overview of all individual participants that participated in one of your experiments for real-time control purposes.In this section, you can create experiments (and all tasks within an experiment). The platform provides a range of different tasks which you can select to use in one experiment (an experiment can consist of multiple tasks).
We speak of experiments on this platform, but of course you can call this a study if you collect data by observing people doing their tasks.
Here you can download the data of your experiments, either as a batch download of all your studies, per experiment, or per individual task.
Furthermore, you can find the number of participants per experiment in this section.
The platform offers an annotation function for keeping log files of your experiments or to make notes (or other experiment guidelines).
On this page, you will find an overview of the people you invited to view your experiments and share your data.
Here you find example sample images in the correct dimensions for best cross-platform performance (pc, tablets or cellphones).
You also find common (priming) stimuli you can use, for example a fixation cross.
This page, where you find an overview of the main menu functions, and short step-by-step tutorials on how to create and manage your experiments and tasks.
How do I create and manage experiments, tasks and questions (or other actions)?
Here you find step-by-step tutorials:
From Experiment, to Task, to Question (or other actions)
You have to create an experiment first, before you can add tasks with individual questions and actions.
See an experiment as the toolbox, the tasks are the data gather tools in that box.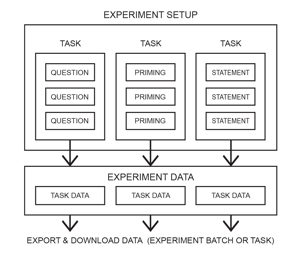
Every task consists out of one or more specific actions (like looking at stimuli, making choices, answering questions, etc.).
In the image you see a setup of an experiment consisting of various tasks. Each task contains one or more actions.
You can use imagery in every task/question/action. All response (reaction) times are measured in milliseconds. Note: In the interface we use Tasks for all type of tasks, and Questions for all type of actions within a task.Go to the type of tasks you can use in your experiment on this page
Go to the image/stimuli formats you can use in your tasks on this pageCollecting Data
Per experiment a unique url code and QR-code is generated, which you can use in your communications.
Now, conduct your study on every mobile phone, tablet or PC, on any location.
WorldBrainWave works in all browsers on any mobile, tablet or desktop (no app install).Viewing Data
You can (pre)view your research results (only 'click' data) in your dashboard in Chart Results, which you can find in the main menu.Downloading Data
After you have finished your study, survey or experiment(s), you can download your data in .csv format in the Results / Downloads section, which you can find in the main menu. You can download a complete batch of the experiment or download clean data per task.Go to the Downloading Data section on this page for information on how to download data
TIP: Please complete your profile page first.
This helps (if needed) fellow researchers to find you by your research projects on the platform.Create Experiment
1 min setup if experiment information (Informed Consent, Study Information, Briefing and Debriefing) is already available.
Select Experiments in menu on the left side of the screen
Select Add new (green button) to add a new experiment
Insert experiment Title, Informed Consent and Study Information, Briefing and Debriefing
Select Save
Note: The Title, Informed Consent and/or Study Information, Briefing and Debriefing can be updated or edited or deleted at any time by selecting 'Edit' or 'Delete' on the experiments screen.
Manage Experiment
Below you see an overview of the Experiment bar with the tool options.
Experiment Options
Every experiment offers a set of more advanced Options. These can be accessed by selecting the white Options button in the Experiment tool option bar.Here you find:
Ask location – This option lets you view the location where users login to participate. Participants will see beforehand a consent pop-up on their browser, asking to share their location data. Accepting or refusing will not influence the study or data collection.
You can monitor the location of data collection in Chart Results.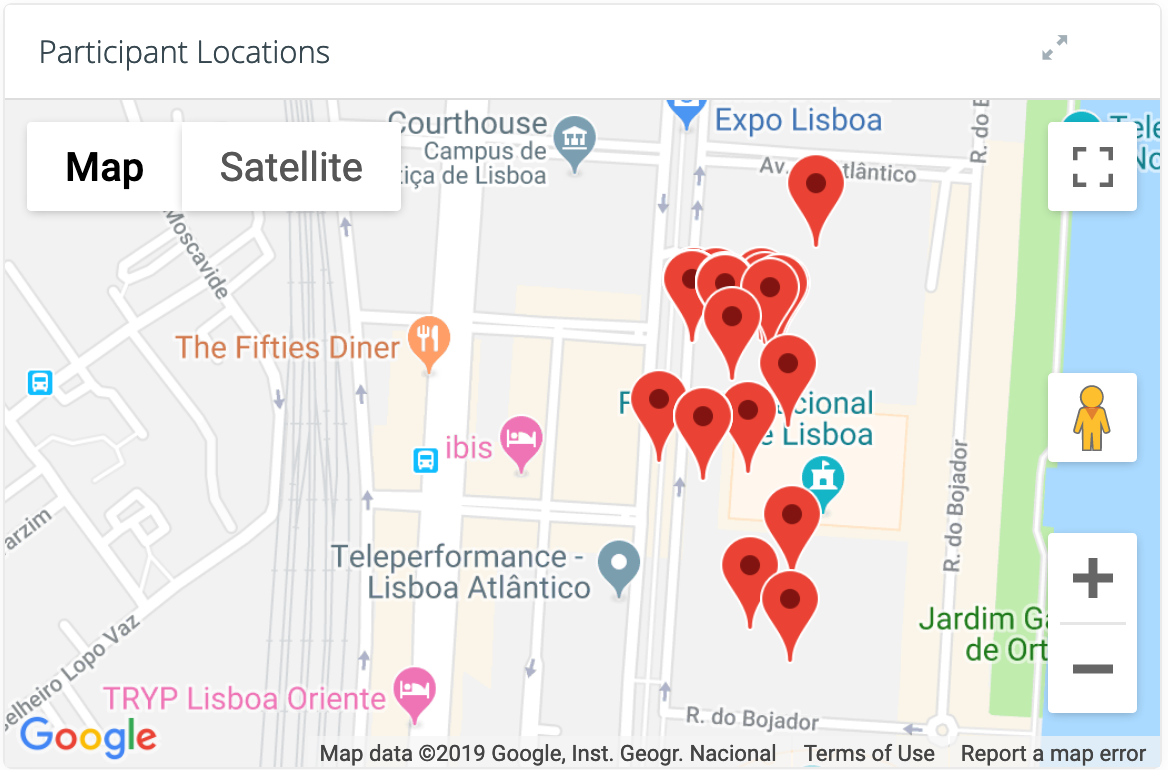
Active informed consent – Ethical guidelines for academic studies require an active informed consent. Selecting this options disallows participants to continue to the experiment without having read the study information and informed consent. Furthermore, it creates an option to refuse participation, thus sending participants towards the end of the experiment.
External URL – You can automatically send participants towards an external URL once they completed the experiment. This will be called as soon as the debriefing appears, so make sure to include the debriefing or final notes as instructions into the experiment if you choose to use this option.
SONA connection – Worldbrainwave offers the option to have SONA automatically grant credits to your participants, if they completed your experiment through SONA. To do so, make sure to add the correct URL both on the side of WBW as well as on the side of SONA. You do not need to add any type of survey code or token, just paste the URL into the correct box and make sure your URL ends with ‘=’.
Important: When using SONA, be aware that an extra Debrief (Instruction) page has to be added at the end of your study (as particpants are automatically redirected to the SONA website, skipping the regular Debrief page at the end).
Filter options in experiment overview:
You can filter your experiment overview on the experiments screen (in the head menu) with:All Experiments- you see all experiments, including active, non-active and experiments from researchers you invited to work with
Personal Experiments - you see only your own experiments, showing toggles both active with 'yes' and non-active with 'no'
Active Experiments - you see only your experiments that are currently running; only showing active toggle with 'yes'
Note: When selecting Personal Experiments and Active Experiments only your own active experiments are shown.
Experiments are shown in order of last creation data or update (shown on top).Create Tasks
Select Manage Tasks on the Experiments screen
Select Create New Task for new tasks or Add Existing Task to use pre-existing tasks
Insert task Title
Select the Type of task
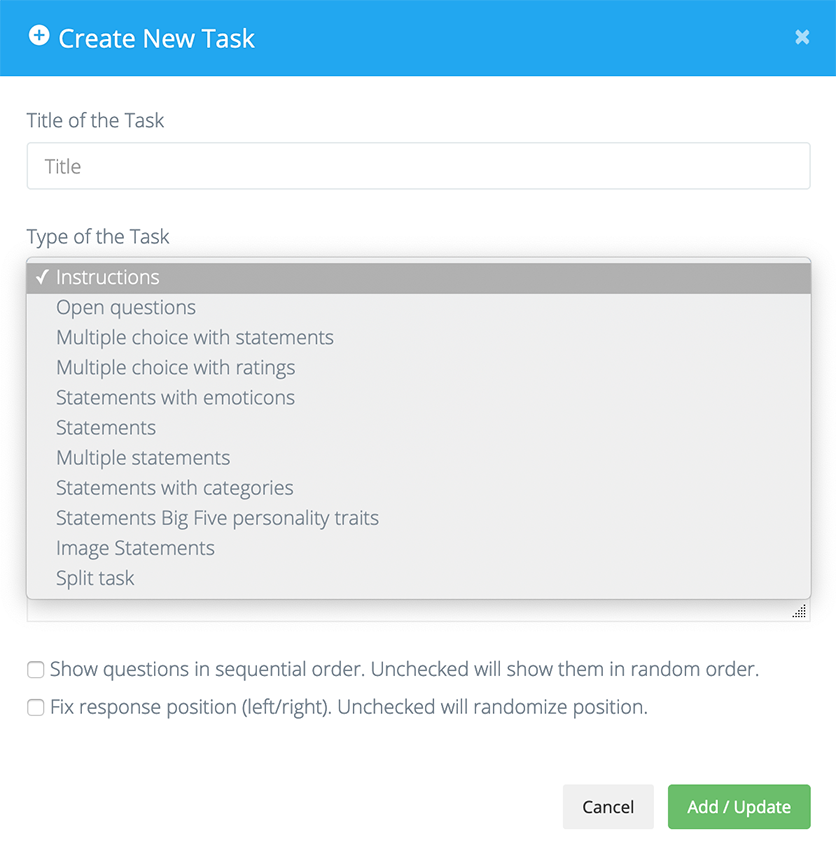
Insert Instructions to show to the participant before the task (or leave empty to skip)
Select 'Show question in sequential order' if you want to show questions alwys in same (strict) order.
Select 'Fix response position' if you want to show two images always on the same left/right position.
Select Add/Update
Note: You will see the tasks in the Task bar. Each bar consists out of an unique ID number, Title and task subscription (as a helpful reminder).
The Title, Type of task and Instructions can be updated, edited or deleted at any time by selecting 'Edit' or 'Delete' in the Task bar on the Tasks screen.
Manage Task
Below you see an overview of the Task bar with the tool options.
Note: You can simply change the order of Tasks by dragging and dropping the Tasks to re-arrange them.
You can remove a task from an experiment (but keep it for later use) or delete the task completely (including all its contents).
To remove a Task:
Select Remove (yellow button) on the Tasks screen
Note: When you only remove a task, the task (including its contents) stays in your account for other experiments.
You can find the removed task in the pulldown 'Add Existing Task' menu on the Tasks page.
A removed Task will stay visible in the 'Add Existing task' menu, so you can reuse the task).To delete a Task:
Select Task Overview (dark grey button) on the Tasks screen
Select Delete (red button) on the right of the Task you want to delete.
Note: Be aware, when a Task is deleted, you delete all the questions, actions and stimuli imagery it contains as well!).
It is strongly adviced to export questions (including its imagery) as a backup before deleting a Task (see Export Questions).
In this way you can recover your work, should you change your mind in the future.
A deleted task will disappear from the 'Add Existing Task' menu.Select Manage Questions (green button) on the Tasks screen
Select Add New (blue button)
Insert questions and/or primes, depending on task Type
Select Create New Question
Note: The question details can be updated, edited or deleted at any time by selecting 'Edit' or 'Delete' on the Tasks Questions screen
Go to Question Import & Export on how to import question items in a task
Type of Tasks
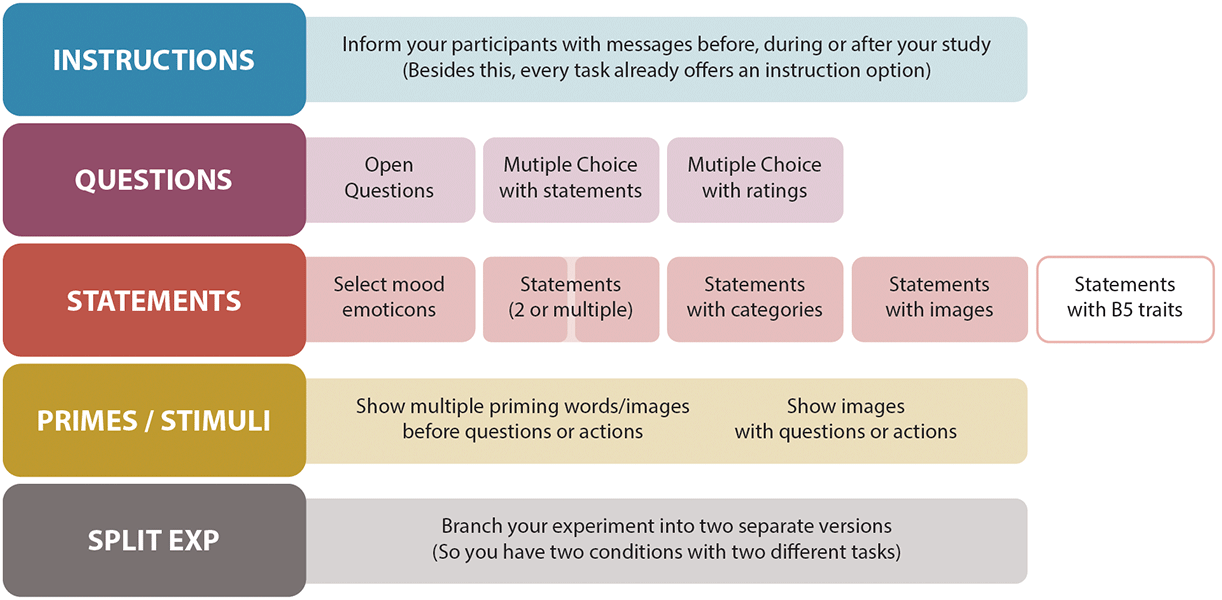
Currently, there are 11 different tasks with stimuli options available in Resultal.
Step-by-step Task tutorials
Select a Task to read the step-by-step tutorials.
The tutorials start when you already added a task to an experiment:Adding new task:
Select Create New Task in the experiment screen, and choose the task you which to use
Editing already added tasks:
Select Manage Questions in the specific task bar
Adding a new instruction:
Select Create New Task (green button) and set type of task to Instructions
Insert title
In the box, add instructions to show participants
Select Add/Update
Editing an already added instruction:
Select Edit (blue button) in the Instructions task bar
Insert title
In the box, add instructions to show participants
Select Add/Update
Tip: You can use Instructions as well for additional/obligatory reading information (like informed/legal consent) at the start af your study. Or use it for addtional debrief information at the end of a study. The Informed consent and Study information screens are already offered in the Experiment section, and shown as page links at the 'Agree' page.
Select Manage Questions (green button) in the task bar
Select Add New
Insert your question
Optional: Select add image to display a picture above the question
Select Create New Question
Note: Open (written) answers are not visible in Chart Results (this dashboard only displays quantitative/numerical data).
After completing your study, you can find all open answers from participants in the Results / Downloads section.
Here you can download a .csv file with the answers provided (you can import .csv format as a text file into Word, Text, Notes, etc.)Select Manage Questions (green button) in the task bar
Select Add New
Insert your question or statement
Insert your answer option
Select the cross to create more answer options and repeat (max 9)
Optional: Select add image to display a picture above the question
Select Create New Question
Note: As this is 'click' data, you can (pre)view your results in the Chart Results section.
After completing your study, you can download your data in the Results / Downloads section.Select Manage Questions (green button) in the task bar
Select Add New
Insert your question or statement
Optional: Select add image to display a picture above the question
Select Create New Question
Note: As this is 'click' data, you can (pre)view your results in the Chart Results section.
After completing your study, you can download your data in the Results / Downloads section.Select Manage Questions (green button) in the task bar
Select Add New
Select Choose File to upload your picture
Select Create New Question
Note: As this is 'click' data, you can (pre)view your results in the Chart Results section.
After completing your study, you can download your data in the Results / Downloads section.Select Manage Questions (green button) in the task bar
Select Add New
Insert your question or statement
Optional: Select add image to display a picture above the question
Select Create New Question
Note: As this is 'click' data, you can (pre)view your results in the Chart Results section.
After completing your study, you can download your data in the Results / Downloads section.Select Manage Questions (green button) in the task bar
Insert category and select Create Category
Repeat until all categories are added
Select Add New
Insert question or statement and select corresponding category
Optional: Select add image to display a picture above the question
Select Create New Question
Note: As this is 'click' data, you can (pre)view your results in the Chart Results section.
After completing your study, you can download your data in the Results / Downloads section.Select Manage Questions (green button) in the task bar
Select Add New
Insert your question or statement
Select Big Five personality trait
Select Create New Question
Note: As this is 'click' data, you can (pre)view your results in the Chart Results section.
After completing your study, you can download your data in the Results / Downloads section.To add an image to a question or action:
Select Manage Questions (green button) in the task bar
Select Add New (blue button) in the Question screen
Upload your image at the Stiumulus Images frame at the right of the page (use Browse...)
Select Create New Question
To add a (series of) prime image(s) before a question or action:
Select Manage Questions (green button) in the task bar
Select Add New (blue button) in the Question screen
Insert your question or statement (you have to do this first, before you can add primes)
Select Create New Question
Select Edit (blue button) to go back to the question
Select Type / Image (toggle) to choose words or images
Adjust showtime in milliseconds and type text or upload image file (use Browse...)
Select Create prime (blue button). Repeat this with multiple primes.
Important: You cannot (in this BETA version) change the order of the primes, so upload your files in the right order!
Note: The following Tasks do not support this function: 'Instruction', 'Statements with Big Five personality traits' and 'Split task'
Create and test a split task in a 'sandbox' experiment first:
5-10 minute setup
Before you start implementing a split task, it is adviced to create a second 'sandbox' experiment to view and edit the two tasks you want to split.
After thoroughly testing you can add the split task into the experiment where you want to have the two conditions.
This is because you cannot view the tasks in the experiment where you want to use the split task
(you only add the Split task, not the tasks you split, you can find and edit these tasks in the 'sandbox').Creating the two tasks you want to split:
Start with creating the two tasks (with different conditions) you want to split in your 'sandbox' experiment
Both tasks have a unique task ID, which you find at the beginning of each task bar (something like E169-382)
You only need the task ID, in this example 382 and 383.
Creating the Split task:
Select Create New Task (green button) and set type of task to Split task
IMPORTANT: Insert in the Title field, the task IDs as follow: [task id, task id]
You get something like this: [382,383]Leave the Instruction field empty (you don't need it)
Now use the test run functions and test several times the split function
(You can start the test run function by using 'Test this experiment' and 'Test url' (orange buttons)After testing in the 'sandbox':
Select Add Existing Task to import the Split task in the experiment you want to use for your study
Place (by drag and drop) the Split task (before/after other tasks) where want to split your experiment into two conditions
When you already added the Split task in your 'sandbox' or final experiment:
Select Edit (yellow button) in the Split task bar to edit the Title field in the split task
Questions Import and Export function | Using Libre Office
WorldBrainWave offers the possibility in most tasks to export and import questions as a .csv file.
This functionality lets you create tasks and questions much quicker by saving you a lot of repetition.Note: .csv markups differ per task.
To start with the right .csv format, export a .csv with question items from the task you want to use first.
You should not change the document markup (like text field order) and format, to run imports properly.
The .csv (with the right question item markup) can be used for creating new question items in that particular task.We strongly suggest to use Libre Office to alter questions in a .csv.
This free csv editing software lets you make alterations in the file, withouth changing the format settings.DOWNLOAD LIBRE OFFICE for free (Mac / Windows / Linux)
Sample Stimuli (Imagery)
Presentation times
WorldBrainWave offers high accuracy and stimuli precision on location or in lab settings.
But stimuli refresh/load rate depends on the device used: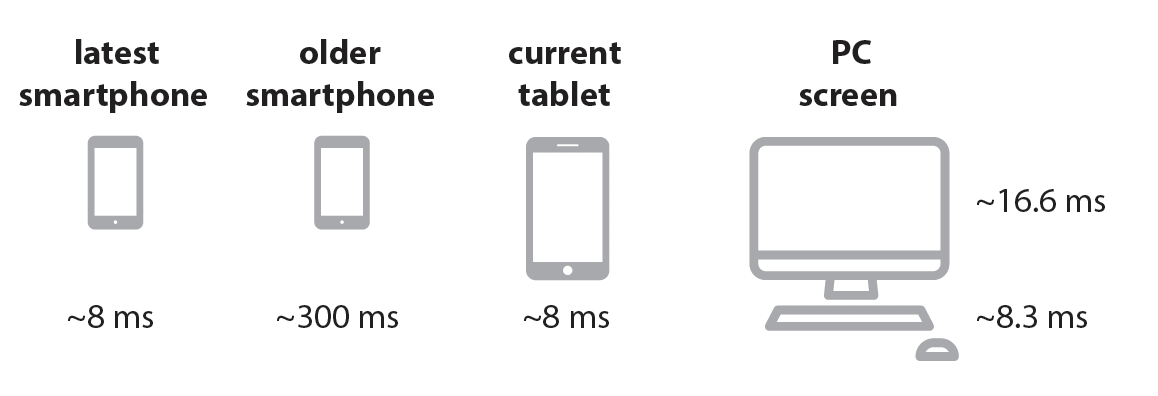
For smartphones; the older the slower the screen refresh rate and browser load time,
varying from 8-20 ms (fastest models) to 200-300 ms (older and slower models).Note: It is adviced to use a minimum of 200-300 ms showtime when you use rapidly changing priming images on smartphones on location.
In this way you also cover older/slower mobile phone types or other possible (connection or render) delays.For PC/laptop: The refresh rate of an avarage PC-monitor is around 16.6 ms.
By altering the amount of ms of short priming images, you can test your setup.
Stimuli (image) sizes
In the Resources section (in the left main menu) you can download sample images in the right sizes that will help you to create stimuli artwork in the correct dimensions for best cross-platform performance (PC or smartphone screens). You also find common (priming) stimuli free to use.
IMPORTANT: Do not upload hi-res files! Upload only stimuli in the correct pixel/dpi size (see dimensions below for best results).
In the current version (v1.1.7), you have to upload imagery in the size(s) that you want to use (in next version, imagery will be automatically scaled).For Smartphone screens:
Priming files - pixel size 350 (h) x 350 (w), 72 dpi
This is the optimal image size to use for priming purposes (shown before questions, no other items in the screen).Priming / Imagery files - pixel size 250 (h) x 350 (w), 72 dpi
Please use this image size in combination with questions or other button options.For PC/tablet screens:
Priming files - pixel size 400 (h) x 400 (w), 72 dpi
This is the optimal image size to use for priming purposes (shown before questions, no other items in the screen).
But as this is shown on laptop screens, you could use format sizes to your own discretion.Priming / Imagery files - pixel size 350 (h) x 400 (w), 72 dpi
Please use this image size in combination with questions or other button options.
But as this is shown on PC/laptop screens, you could use format sizes to your own discretion.
Any questions?
If you have a question about how to use this platform,
please send us your question
